

Small Caps – August 2022
Small Caps for the Road Ahead
At Pullen Investment Management, we play the dual role as both an asset allocator and portfolio manager for our clients. Our managed strategies keep our head down, focused on finding individual stocks for each of the strategies. At the same time, we look up and around to help many of our clients with their broader investment allocations, balancing their individual needs and goals. Many times, these two roles come together, and our new stock ideas and changes to our clients’ asset allocations resemble one another.
In February of 2021, we published a note on commodities, highlighting their attractiveness as a hedge against inflation and the diversification they offered given stretched equity prices and low bond yields. Over the course of 2021 and even into 2022, we added to our commodity holdings within our managed strategies, which has proved helpful as commodity-oriented stocks have performed well. In fact, Energy was the strongest performing sector in the S&P 500 last year and it is the clear standout in 2022. Additionally, where appropriate, we incorporated what we called our “Commodity Basket” into our clients’ broader allocations, which has also proven helpful. Since March of 2021, the S&P/Goldman Sachs Commodity Index (SPGCI), which we referenced in the note, has risen 37% while the S&P 500 Index is up 10%, the Nasdaq Composite Index is down 4%, and the Bloomberg US Aggregate Bond Index is down 8%¹.
Today we see a new allocation shift developing that we want to highlight. For more than seven years, we have managed our Small Cap Equity strategy. We approach this corner of the market much the same as we do for our other managed strategies. We look for Value, Quality, and Catalysts, but in this case, we focus on the smaller companies in the market. We like simple stories and businesses that make sense to us. The small cap market is especially attractive to us as stock pickers given its depth of candidates. There are two times the number of small cap stocks as there are large caps! Additionally, there are fewer eyes looking at these companies and there is less information available. The typical stock in our portfolio might have a few analysts publishing estimates on it, compared to the 40 analysts that scrutinize Apple’s results! To be clear, these are all publicly traded, US listed companies, many of which you might be familiar with, but these companies do not receive the same attention from Wall Street or the media as the mega caps such as Amazon (AMZN) and Apple (AAPL), and that is ok with us! This lack of attention creates opportunities. We spend the time doing the analytical work, and we speak with the executives of these companies when we have questions. Lastly, our focus on Quality, is especially helpful in our search for good investments within the small cap universe. Leverage is higher, and profits are less commons among the small cap companies, and our selection process helps us avoid the junk.
In Chart #1 below, we have presented the relative performance of the small cap index, the Russell 2000, versus the large or big cap-oriented S&P 500 Index. As you can see, leadership has alternated several times between small and large cap stocks over the past 30 years. Small caps lagged big caps in the late 90’s, but that reversed almost a year prior to the peak in the Nasdaq, which occurred in March of 2000. From early 1999 through 2011, small caps bested the big cap index, but the past decade was once again dominated by the big caps. 10 years off, 10 years on, 10 years off…. I am sensing a pattern here.
I will not belabor the point, but there are many similarities to today’s market and the late 90’s/early 2000’s. Innovative technology, speculative growth stocks, day trading, low inflation, and a strong dollar, are all factors that defined both the late 90’s and the most recent decade. Commodities, value stocks, and inflation, have become the themes during the past year and a half, but it looks like small caps might also be emerging as a market leader at least relative to their big cap peers.
The second set of charts look at two valuation multiples, again overlaying the small cap index versus the large cap index to draw a comparison. Not only are the current relative multiples low or “cheap” versus their 20-year median levels, but they are also surprisingly close to the levels 20 years ago!
With the pullback we have seen in the markets, now is a great time to reassess your broader allocations. We would be happy to review your current portfolio and tell you more about our Small Cap strategy.
Chart #1 SMALL stocks versus LARGE: clear, multi-year leadership cycles
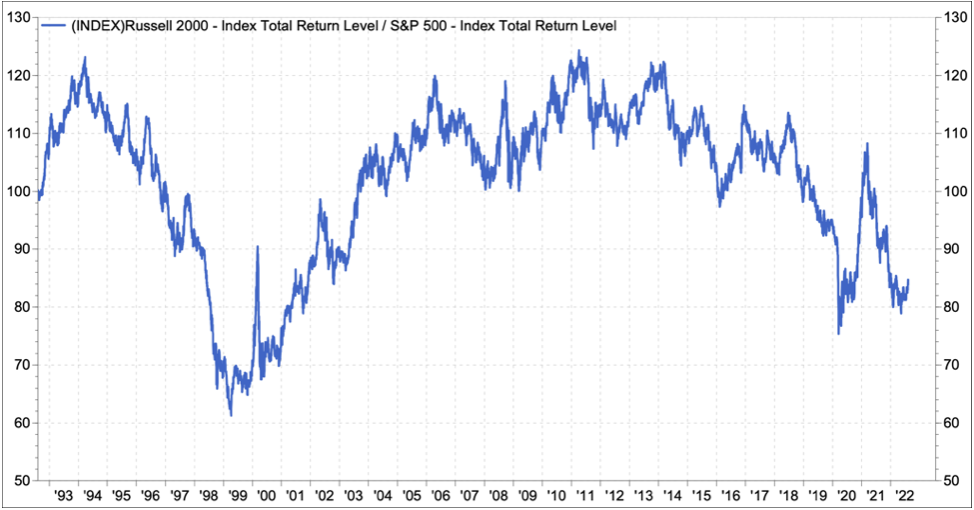
Chart #2 Small Caps look cheap versus Large Caps


Tyler Pullen, CFA
Portfolio Manager
¹ These returns are from 2/26/21 to 8/10/22, are calculated by FactSet and use total return indices for both the Nasdaq Composite (COMP), the S&P 500 Index and the Bloomberg US Aggregate Bond Index. The Commodity basket invested in both commodity-oriented ETFs and commodity producing equities. The SPCGI Index was referenced in the February 2021 note titled “Solutions: Commodity Portfolio”. That note is posted in our Commentaries section on our website, www.pulleninvestment.com and we would be happy to send you a copy.
Past performance does not guarantee future results. Market conditions can vary widely over time and can result in a loss of portfolio value. In accordance with the rules of the Securities and Exchange Commission, we notify you that a copy of our ADV, Part 2A filing with the SEC is available to you upon request.