

Commodities – February 2021
The markets have been on a strong run for the past decade. The recovery last year was remarkable and at times hard to reconcile given the economic fallout caused by the pandemic. Helped by another round of monetary easing, the S&P 500 is up more than 25% and the NASDAQ is up 50% over the past year. These indices have become even more extended in terms of valuations relative to earning or the size of the economy, which is Mr. Buffett’s preferred measure of valuation¹. Additionally, there are more signs of speculative extremes. The runs we saw in stocks like Tesla and Bitcoin last year looks detached from reality. More recently, we have seen day traders run up washed out small cap stocks. This is leading more and more market commentators to draw comparisons to the late 90’s speculative tech bubble. Chart #1 below, which was published on February 5, draws a comparison between the recent path of the NASDAQ Index and its path running up to its earlier peak in 2000.
The topic of inflation has also returned to the debate circles around the market. Much of the economy’s strength can be attributed to the low interest rate environment. While the Fed can claim some responsibility for this, the absence of inflationary pressures have clearly allowed interest rates to remain low, which has helped to elevate market valuations and has been a big support to our consumer led economy. Oil has spent more time closer to $50 than $100 since 2014, and ecommerce has provided us with greater “price discovery”, which has also dampened consumer prices. There are many other structural reasons for the low inflation over the past decade, including demographics, the deleveraging after the Great Financial Crisis, the deceleration in China’s economy, and the pullback in war-time spending. Many of these forces could remain in place or are not expected to reverse, so low inflation could in fact continue. With that said, tensions between the West and China have been simmering, and restrictions on oil and gas financings and permitting could lead to tighter supply. The strong demand for housing has already pushed prices higher for home buyers and timber prices have followed suit. Gold has been steadily gaining strength for the past two years after sitting dormant since 2012. Additionally, the new administration has signaled that spending will rise considerably, and greater adoption of Modern Monetary Theory or MMT within Washington could dent the US Dollar after a decade of strength.
Over time, the most effective or proven hedge against inflation has been equities. Stock values are tied to profits which tend to rise when prices within the economy rise. Most companies can pass along higher prices; thus, their business models have a built-in hedge to inflation. The only problem with relying on equities to hedge possible future inflation is that many investors either already have enough exposure to equities, or they share the concerns about the market’s valuation that were mentioned above.
A solution to consider is commodities. After equities peaked in 2000, commodities picked up the baton. Chart #2 below looks at the performance of three indices from the end of 1999 through 2003. We pick this date range because the high in the equity markets occurred in 2000. Over this 4-year period, the S&P 500 was down roughly 25%, the Russell 1000 Value Index was flat and a commonly referenced commodity index, the S&P Goldman Sachs Commodity Index (SPGCI), rose 30%.
In the three calendar years prior to the 2000 high in the equity markets, the S&P 500 and the Russell 1000 Value Index rose nearly 100% and 60%, respectively. The SPGCI Commodity Index on the other hand fell 10% (chart #3). For a comparison to the current market, while the absolute returns appear to be smaller, the leadership among these three benchmarks is the same as the pre-2000 run up. Looking back 3 years from today (February 5, 2021), the S&P 500 has gained 37%, the Russell 1000 Value Index is up 10%, and the Commodity Index is down 3% (chart #4). As the saying goes, history does not normally repeat itself, but sometimes it rhymes.
To help our clients gain exposure to commodities, we have constructed a portfolio to provide broad exposure to a diverse list of commodities, in a low-cost and efficient manner. The basket of commodity producing companies are selected primarily because of their historical correlation to various commodities. We make tactical changes to the portfolio, when opportunities arise, but the strategic allocation will be set with the goal of broad exposure to a diverse list of commodities including agriculture, energy, and metals. As chart #5 highlights, while equities have outperformed commodities considerably over the very long run, they currently sit near the high end of their long-term channel. The few times that equities or “paper assets” have broken above this range occurred in ebullient or bubble-like markets. The strength in equities at least relative to commodities or “hard assets” may in fact continue, but if history rhymes, commodities could prove to be a good diversifier in the years to come.
If you would like to learn more about this portfolio, we would be happy to discuss this with you further.
Chart #1 Overlaying the NASDAQ today on its past

Chart #2 2000 through 2003

Chart #3 1997 through 1999
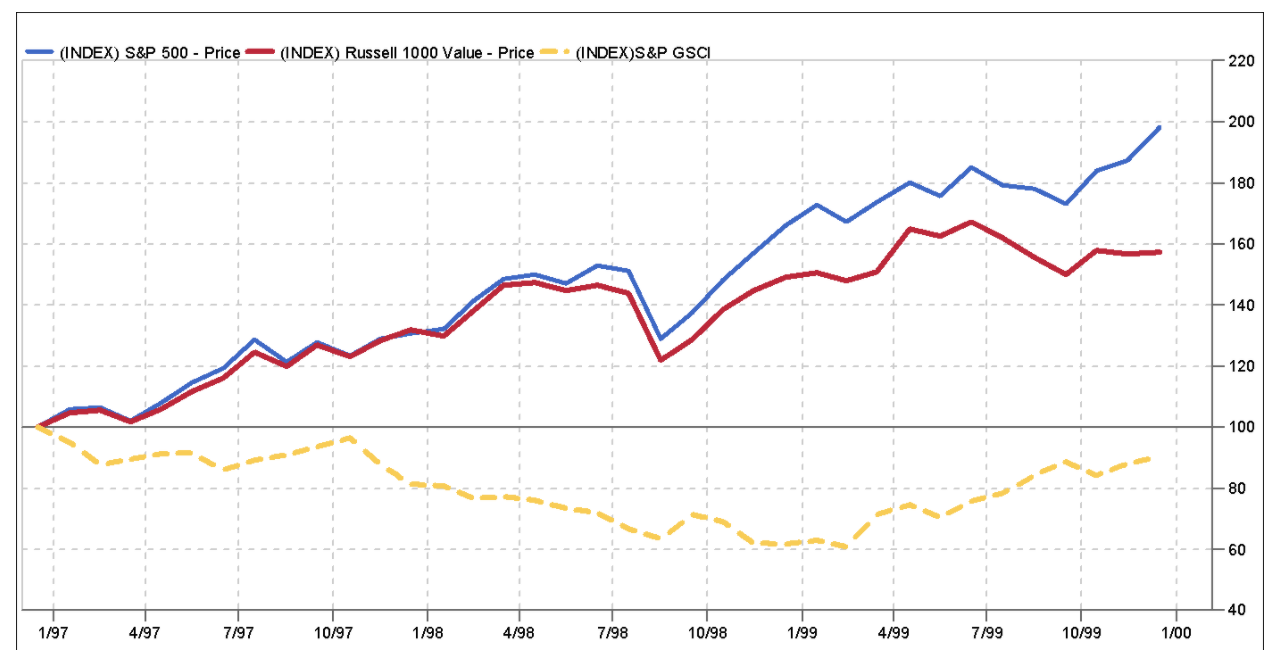
Chart #4 Three years performance going back from Feb 5, 2021

Source: FactSet Research, Stifel, Gavekal Research

Tyler Pullen, CFA
Portfolio Manager
¹ “Warren Buffett's favorite market indicator hits 13-year high, signaling global stocks are most overvalued since the financial crisis”, Business Insider, Theron Mohamed, January 11, 2011
Past performance does not guarantee future results. Market conditions can vary widely over time and can result in a loss of portfolio value. In accordance with the rules of the Securities and Exchange Commission, we notify you that a copy of our ADV, Part 2A filing with the SEC is available to you upon request.